In part one of this series, I showed how to create a SQL Connection and a SQL Passthrough Dataset that returns Data Audit Log information.
In part two of this series, I showed how to create a Dodeca View to display Data Audit Log information.
Now I will tie the View we created in part two to an Essbase View. I will create a right-click menu that allows a user to quickly look up Data Audit Log information based upon a data point in an Essbase View.
To do this I will create a right click menu on an existing Essbase View. The View we use isn’t that important as long as it has an Essbase retrieval range in it.
This is my existing Essbase View. I want to be able to right click on a number here and have the ability to see Data Audit information.
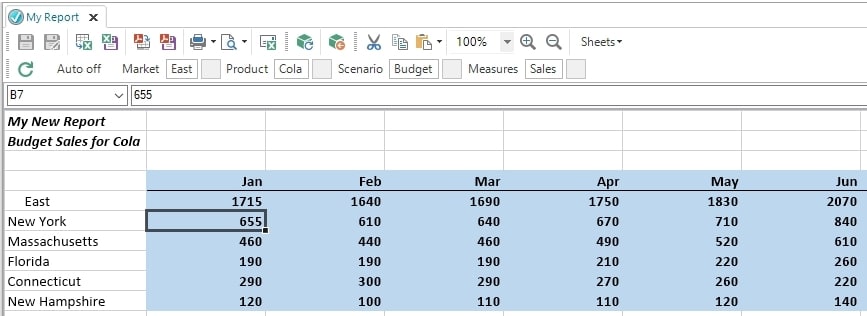
Right click on the view and select “Edit View”.
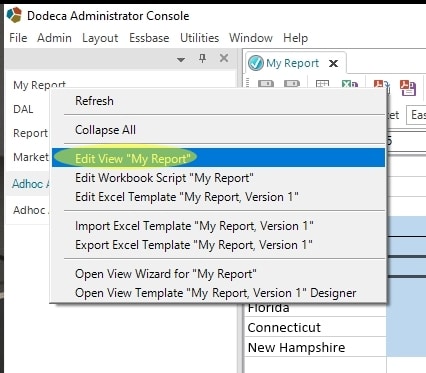
Scroll down to the UI section. Highlight the ViewToolbarsConfigurationID and right click on the blue area. Then select Edit “Essbase View Standard Limited”.

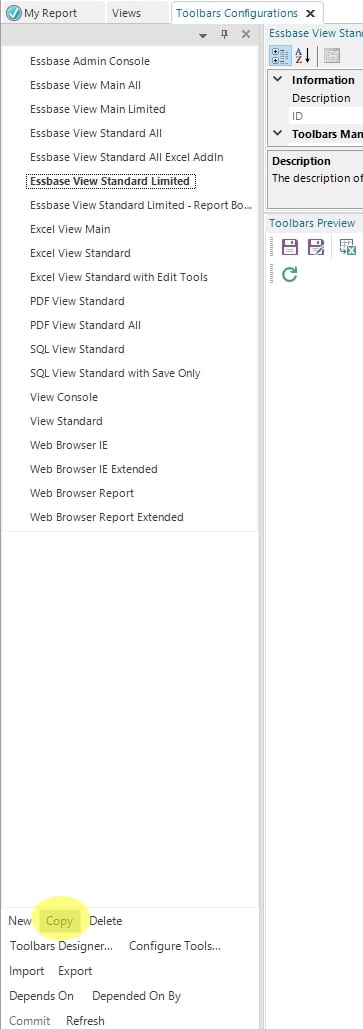
Since it’s very possible that this Toolbar is being shared across several Views, we will make a copy of it that is specific to the View we are currently editing.
Select “Copy” at the bottom left.
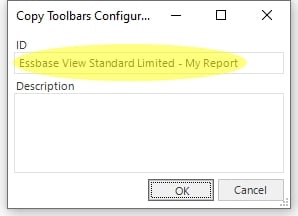
Customize the name of the Toolbar for this View. In this case I’m adding the View name after the current Toolbar name. That way I know which Toolbar is associated with which View.
Enter the new Toolbar name then press the “OK” button.
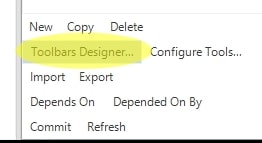
At the bottom left, select “Toolbars Designer…”.
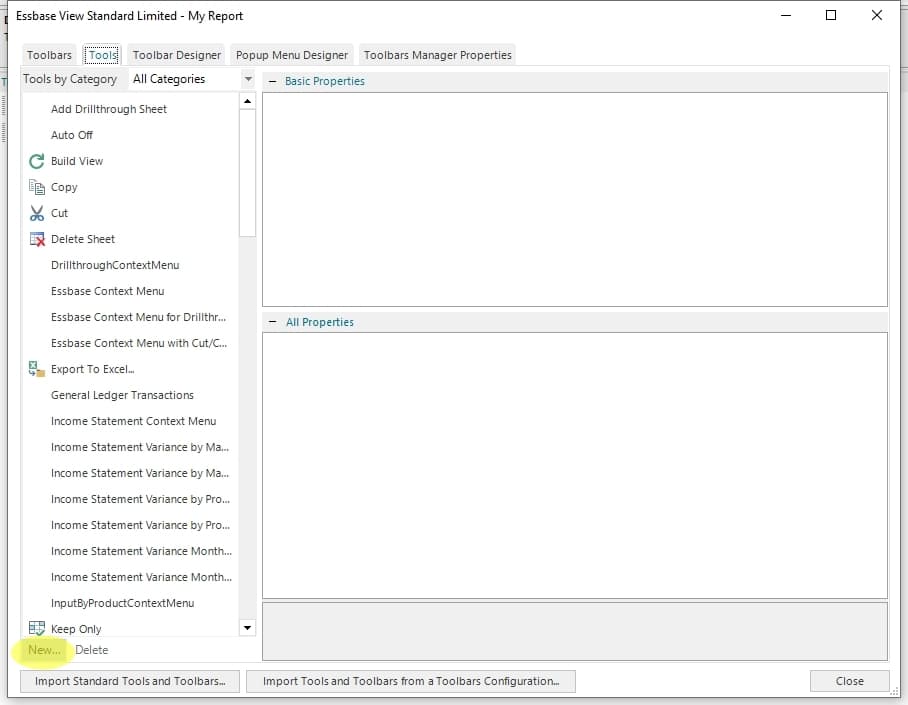
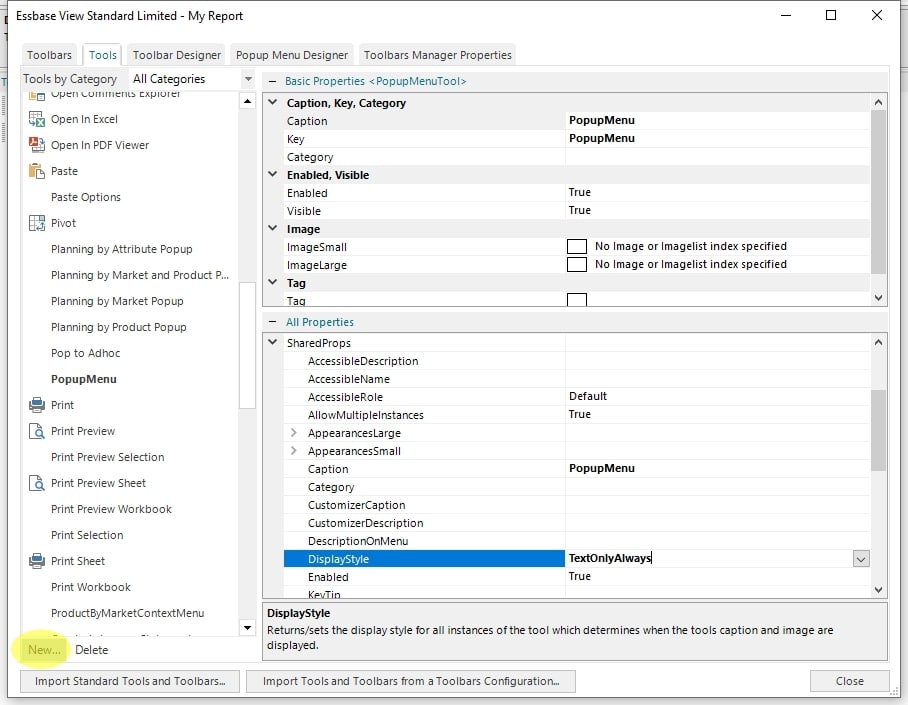
Select the “Tools” tab. Then select “New…” at the bottom.
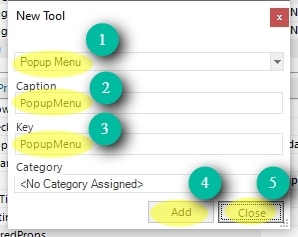
Select “Popup Menu” from the dropdown box. The Caption here will not be visible to users so enter something that will make sense to you as the designer. In this case I entered “PopupMenu” for both the Caption and the Key.
Press the “Add” button then the “Close” button.
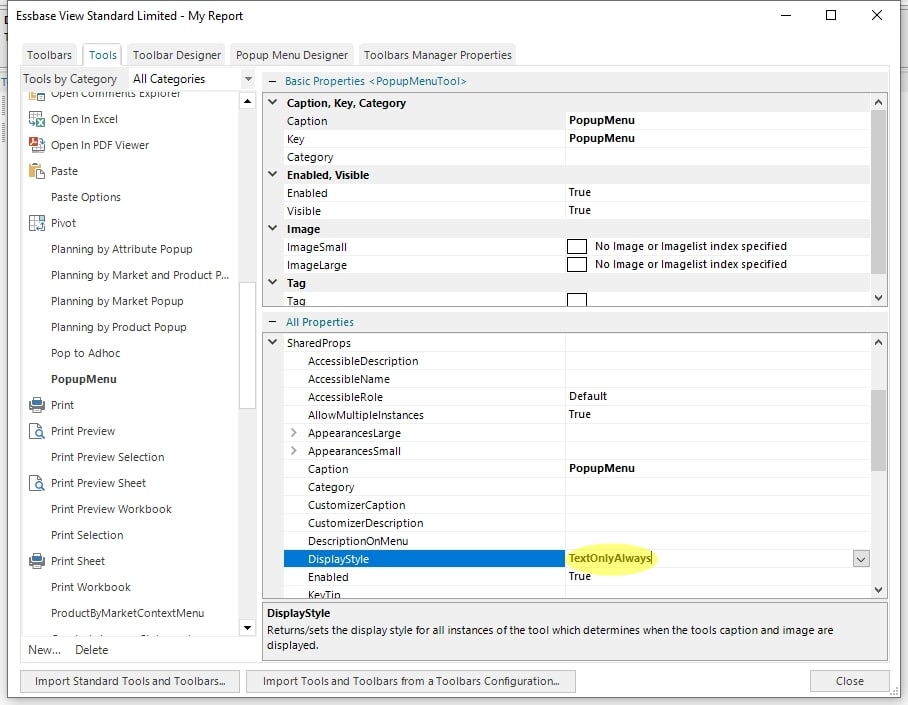
Change the DisplayStyle property to “TextOnlyAlways”. We do this because this popup menu will only be text and will have no icons.
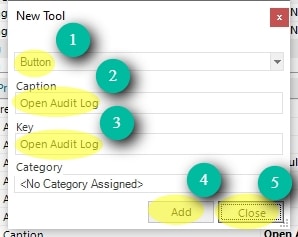
Select “New…” at the bottom left corner.
Select “Button” from the dropdown box.
This is the caption that will be visible to users when they right-click therefore make the caption user friendly. In this case I’ve set it to “Open Audit Log”. I set the Key to the same value.
Press the “Add” button then the “Close” button.
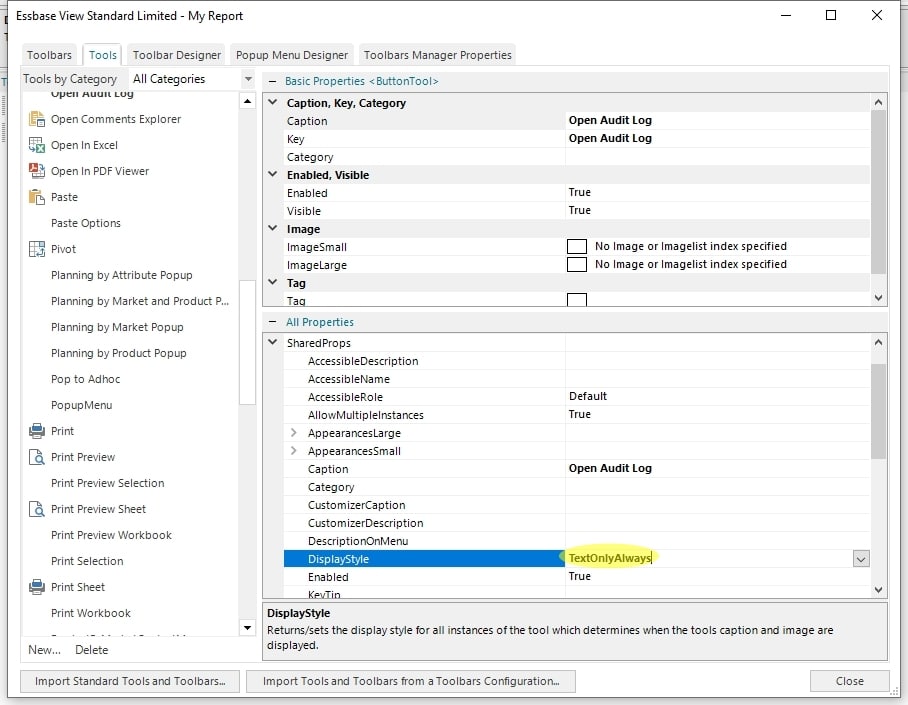
Once again set the DisplayStyle property to “TextOnlyAlways”.
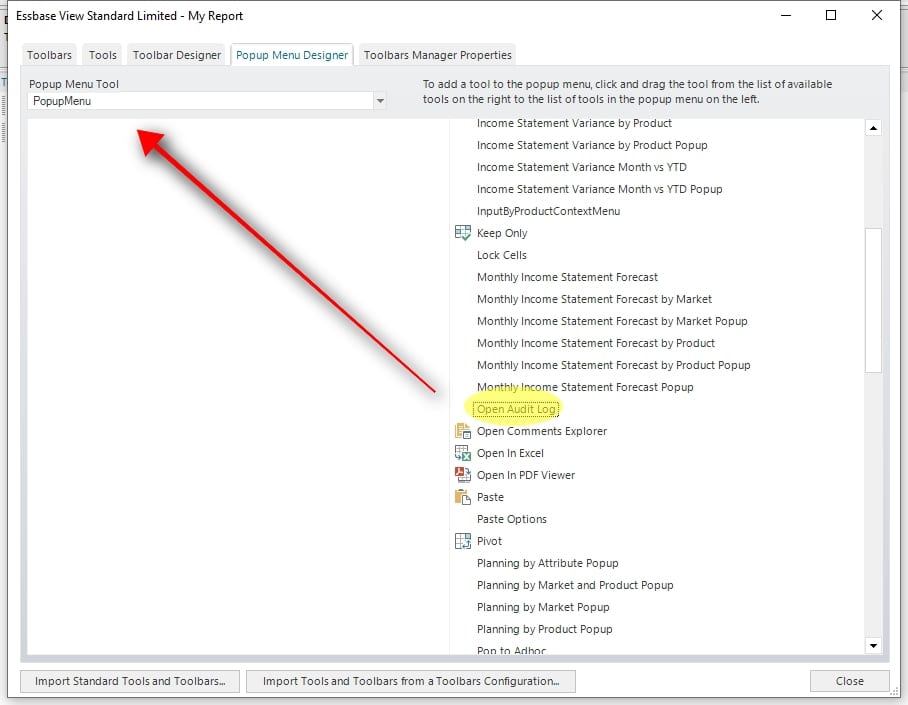
Select the “Popup Menu Designer” tab. Then select PopupMenu in the Popup Menu Tool dropdown box.
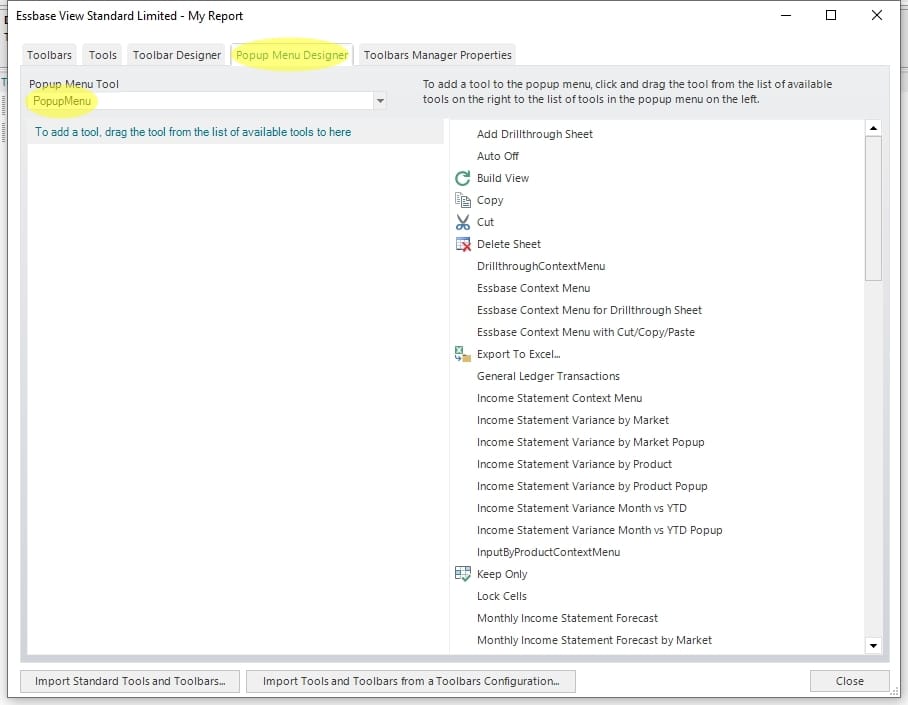
Select the “Open Audit Log” button on the right. While holding down the left mouse button, drag it to the top left just under the Popup Menu Tool dropdown box.
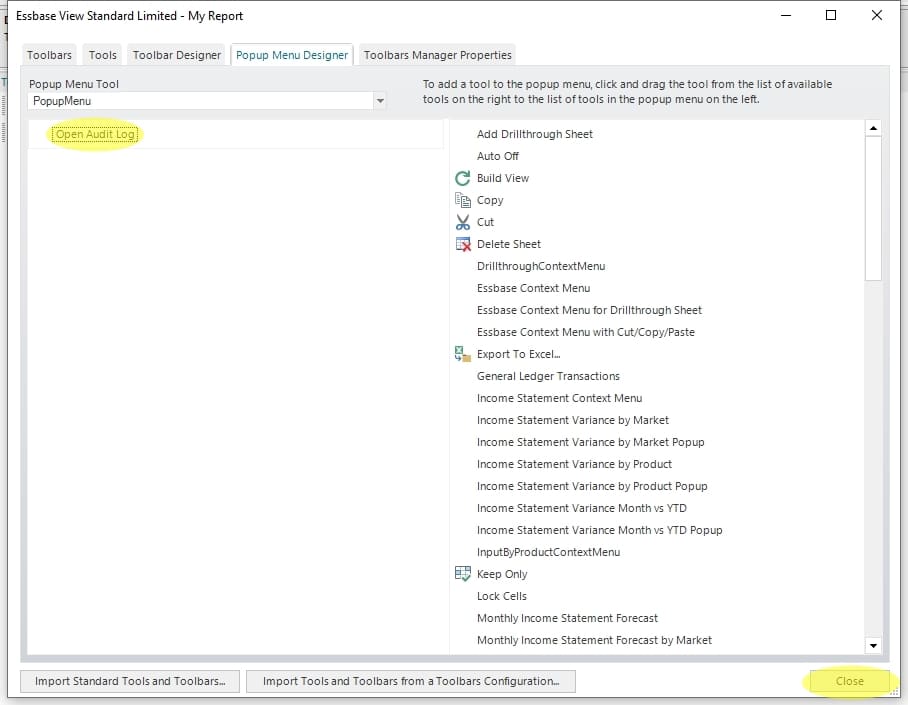
The “Open Audit Log” button should now appear like this. Press the “Close” button.
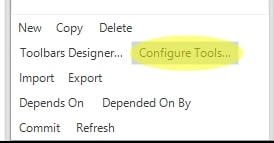
Select “Configure Tools…” at the bottom left.
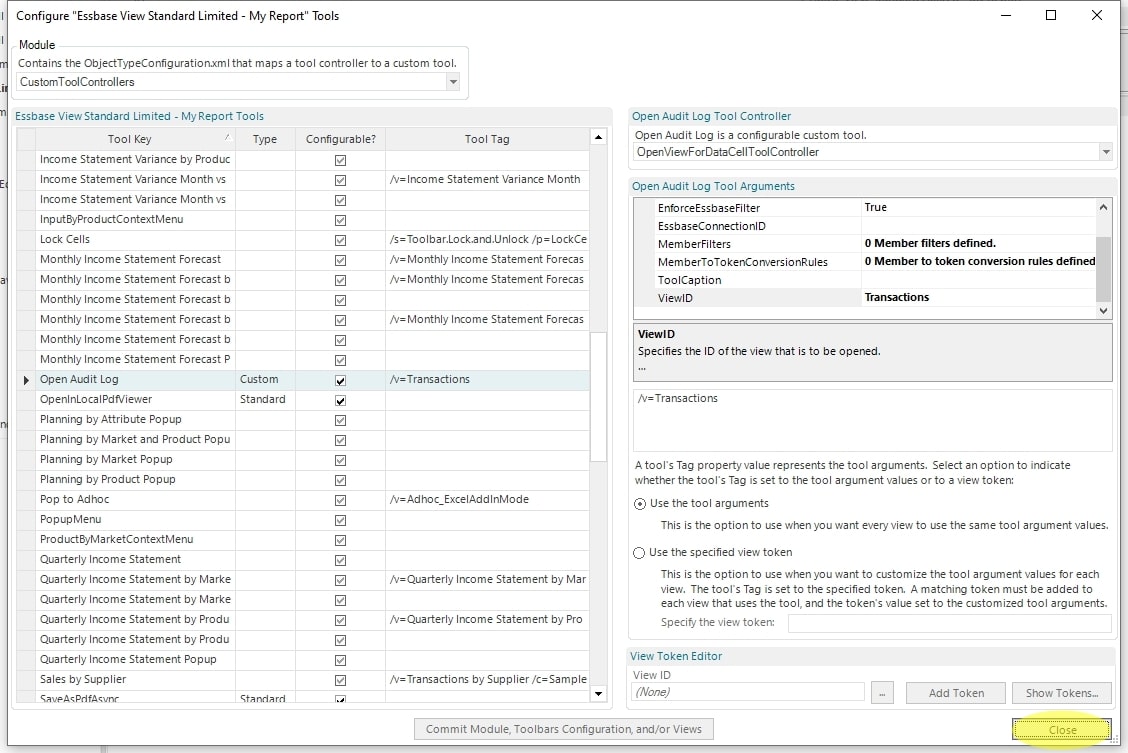
Select the “Open Audit Log” Tool Key on the left.
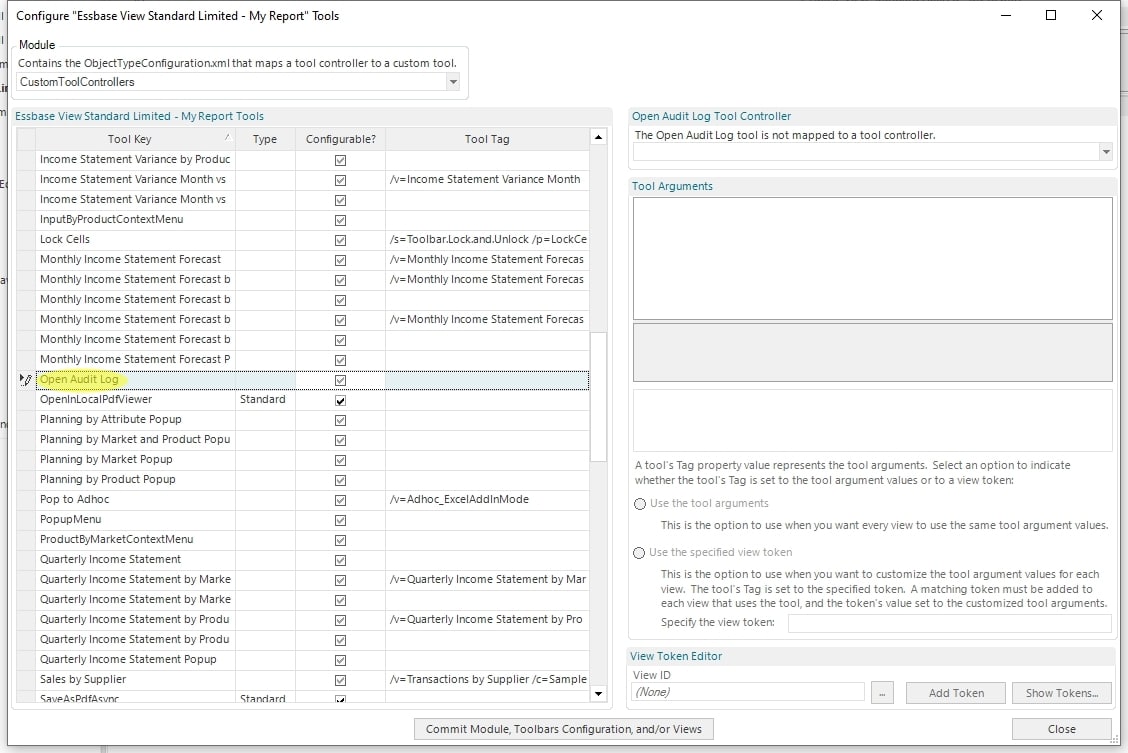
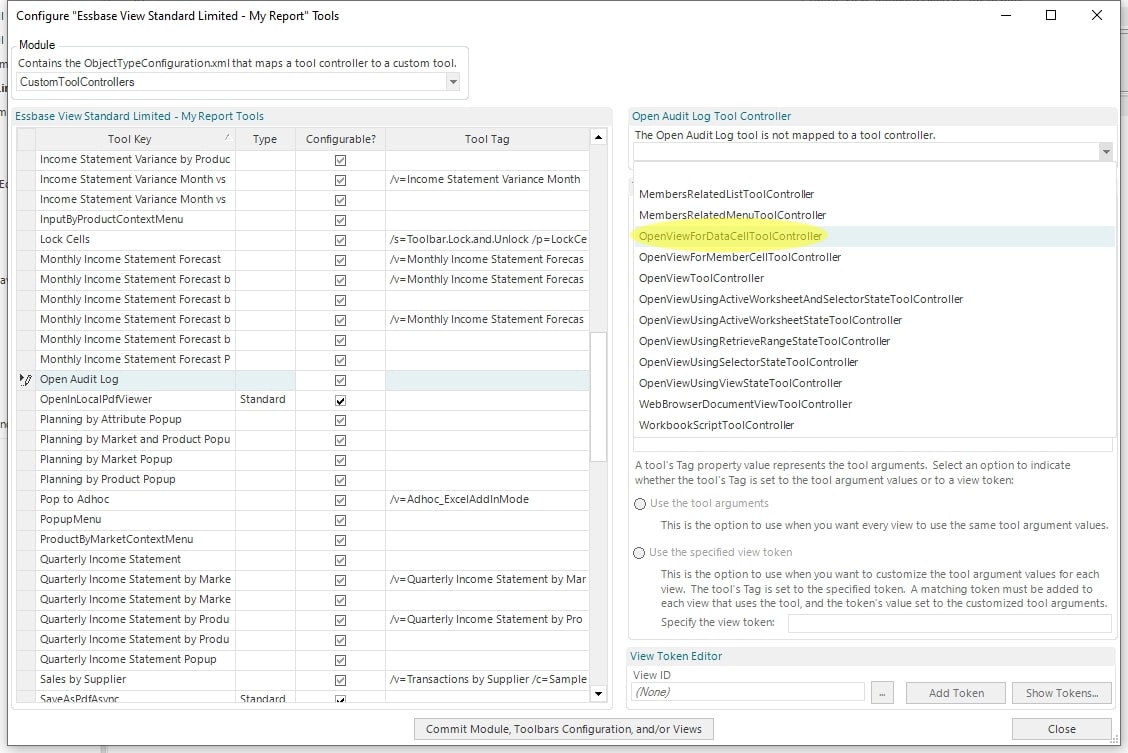
Select the “OpenViewForDataCellToolController” in the Tool Controller dropdown box.
This Tool Controller utilizes Dodeca’s built-in Essbase aware features to recognize which cells in the View contain Essbase data.
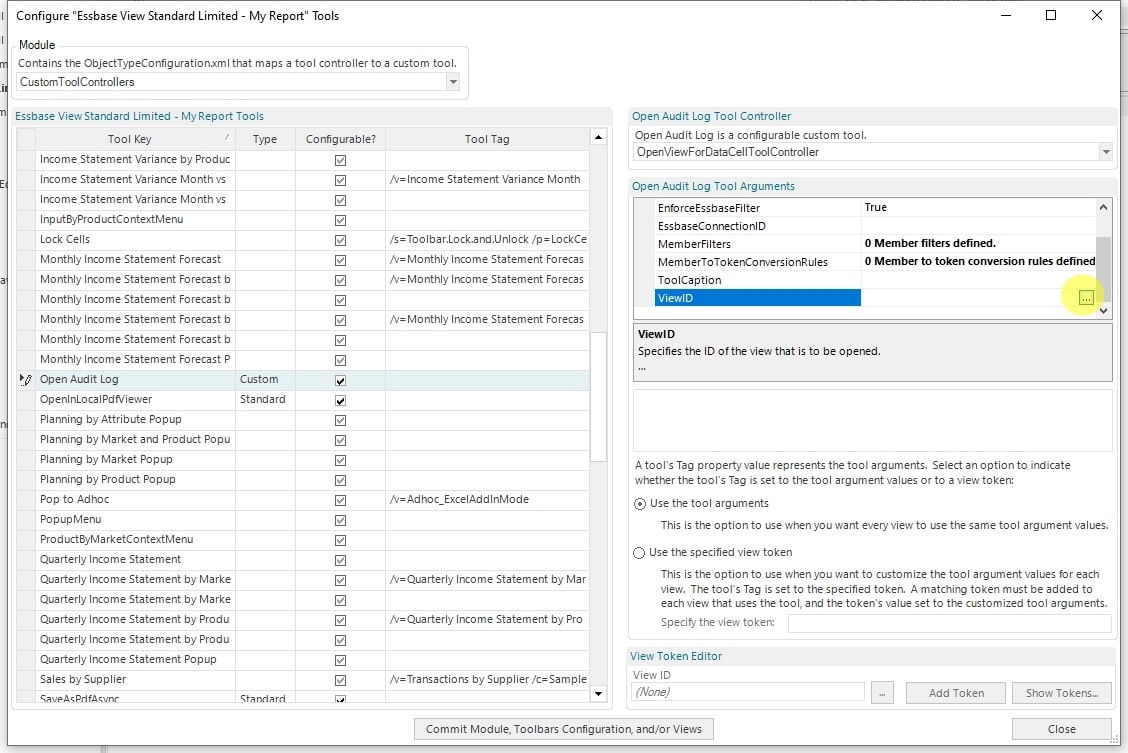
Select the ViewID argument and press the ellipsis button.
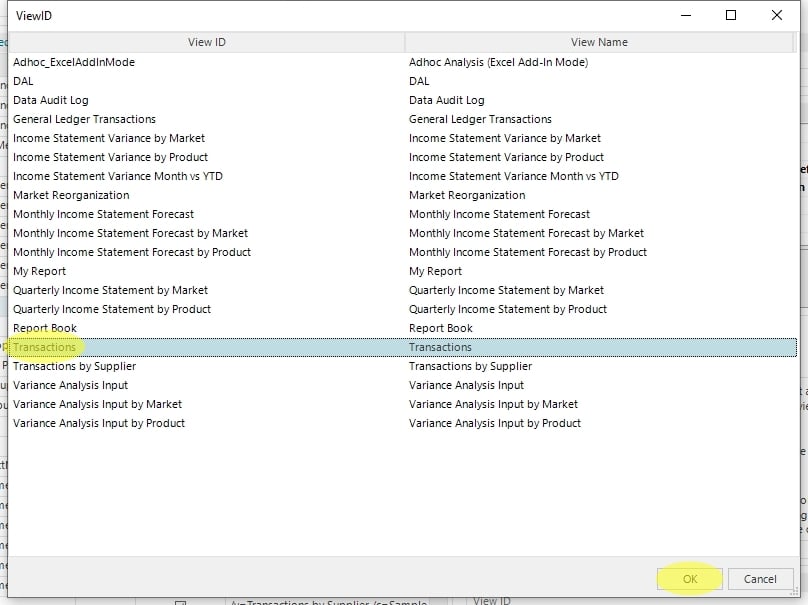
Select the View that will be opened by this menu button. In this case I’m selecting the Transactions View which was created in Part Two of this series.
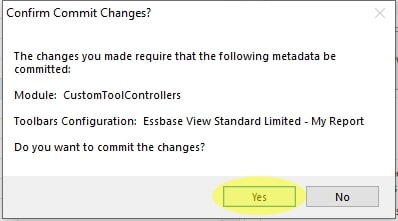
Press the “Commit Module, Toolbars Configuration, and/or Views” button at the bottom.
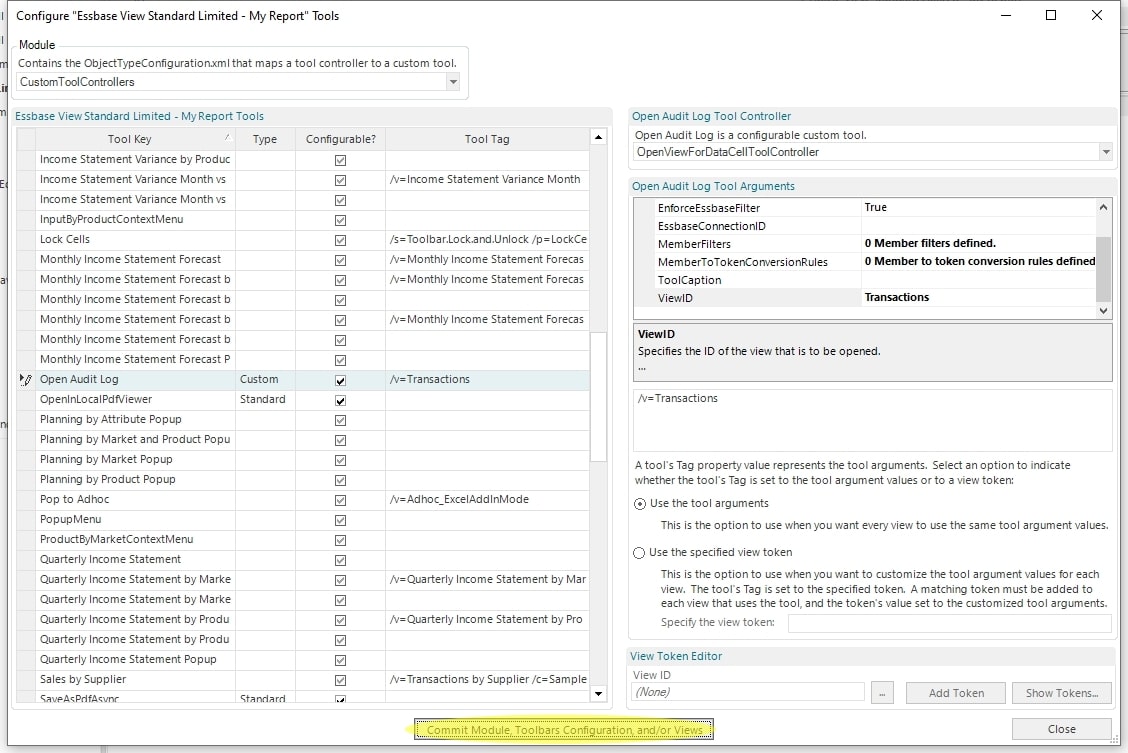
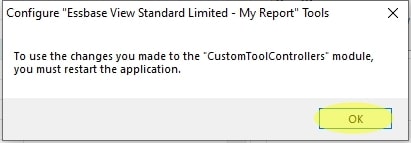
Tool Controller configurations are read when Dodeca first opens. Therefore a restart is required after making these changes.
Press the “Yes” button to commit the changes.
Press the “OK” button.
Press the “Close” button and then restart Dodeca.
Once Dodeca has been restarted, edit the properties for the Essbase View.
Change the ViewToolbarsConfigurationID to “Essbase View Standard Limited – My Report”. Then change the GridContextMenuID to “PopupMenu”.
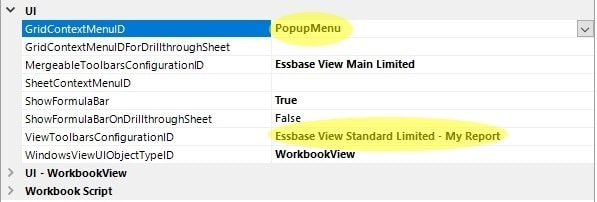
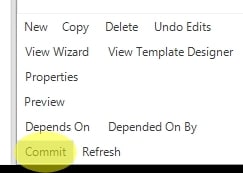
Select “Commit” at the bottom left.
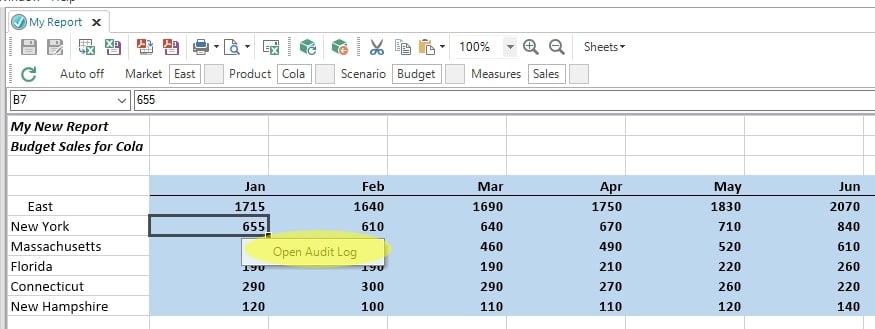
Open the Essbase View. Right-click on a number to make the Open Audit Log menu button appear. Click it to open the “Transactions” Data Audit Log View.
The intersection member information is sent to the Transactions View and the appropriate Data Audit Log information is displayed.


