All of the data that is submitted to Essbase using Dodeca is logged and auditable. It doesn’t matter if the data is sent to an ASO or BSO cube, it gets tracked. Sometimes it’s usefully or even necessary to know who updated a number and when it happened. In this series I’ll explain how to set this up.
Part One will focus on creating a SQL connection to the Dodeca Repository and a SQL Passthrough Dataset to return the correct audit log data.
Part Two will show how to set up the view to display the data.
Part Three will show how to create a right-click menu item that will automatically look up data audit log values based upon the intersection of an Essbase view.
Let’s get started by creating a SQL connection to the Dodeca Repository. This is a connection that might already exist in your environment. If it is, you can skip to the next section. Creating a connection to a SQL database can sometimes be tricky, involving a database driver installation. It’s unlikely you’d have to do that to access the Dodeca repository but if you do need assistance in this part don’t hesitate to send an email to Support@AppliedOLAP.com.
Creating the SQL Connection
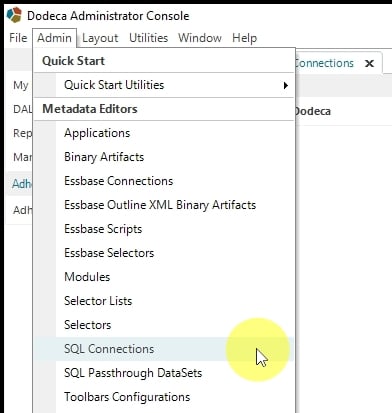
- Select Admin->SQL Connections.
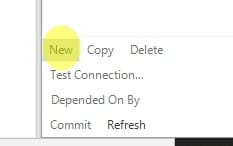
- Select “New” in the bottom left.
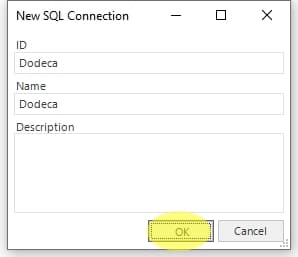
- Add a name for the connection. In this case I’m calling the connection “Dodeca”.
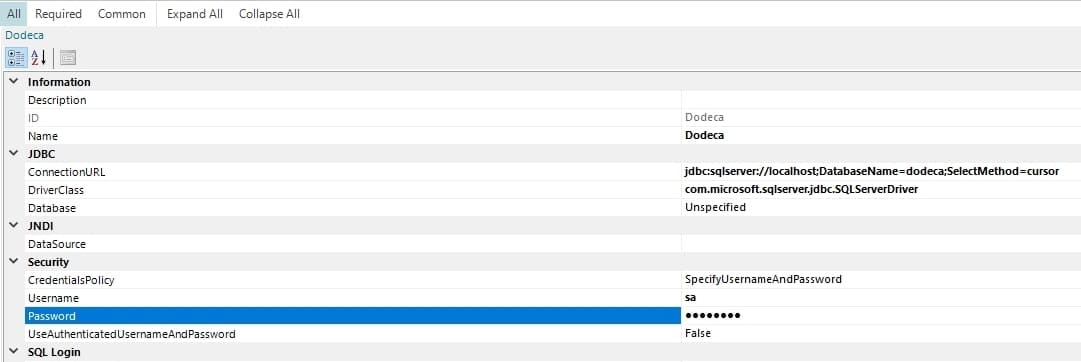
- Fill in the connection information. You might need to check with a Dodeca Admin or DBA for connection and driver information. In this case I’m connecting to my local SQL server instance.
- Test the connection.
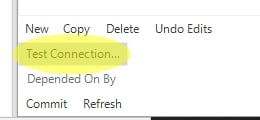
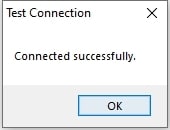
- Hopefully the connection is ok.
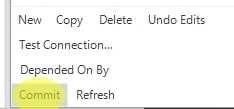
- Commit the connection. Now we can use this connection in our SQL Passthrough Datasets.
Data Audit Log Tables Overview
The next step is to create a SQL Passthrough Dataset that can return audit log information. Let me begin with a brief overview of the data audit log tables in the Dodeca repository.
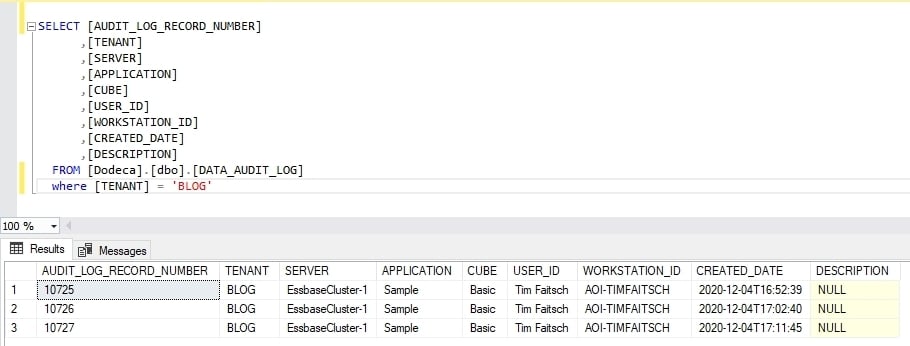
The DATA_AUDIT_LOG table contains AUDIT_LOG_RECORD_NUMBER along with Tenant, Server, Essbase App/DB, user information and created date. The record number can be used to join to the DATA_AUDIT_LOG_ITEMS table.
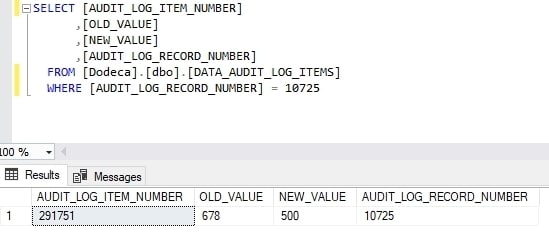
The DATA_AUDIT_LOG_ITEMS table contains the AUDIT_LOG_RECORD_NUMER, before and after data values and the AUDIT_LOG_ITEM_NUMBER. The AUDIT_LOG_ITEM_NUMBER can be used to join to the DATA_AUDIT_LOG_DATAPOINTS table.
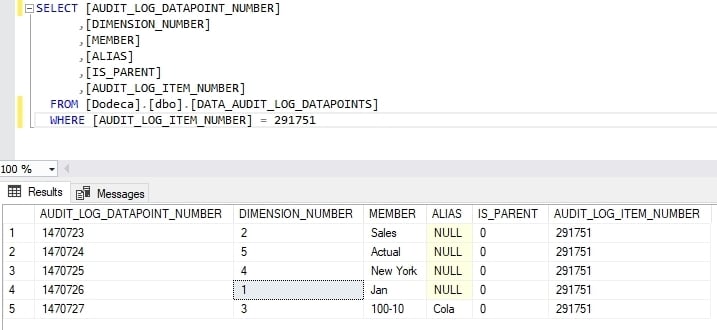
The DATA_AUDIT_LOG_DATAPOINTS table contains the Essbase dimension number, the Essbase member name and alias and the AUDIT_LOG_ITEM_NUMBER.
These three tables, used together, provide the ability look up any Essbase data value that is changed using Dodeca.
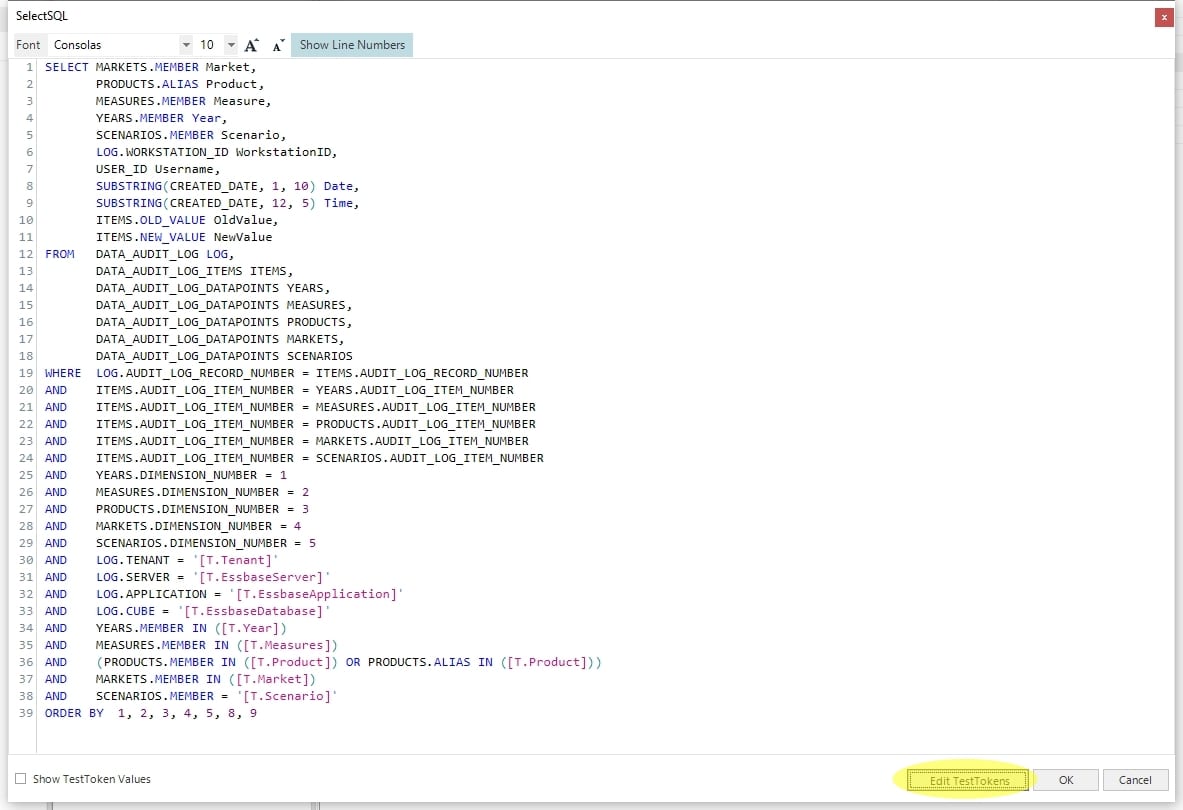
The following query, written for Sample.Basic, can be altered for nearly any Essbase database. Notice that the Products dimension is set to use an Alias rather than a member name. You can use this option for any dimension you’d like using that example.
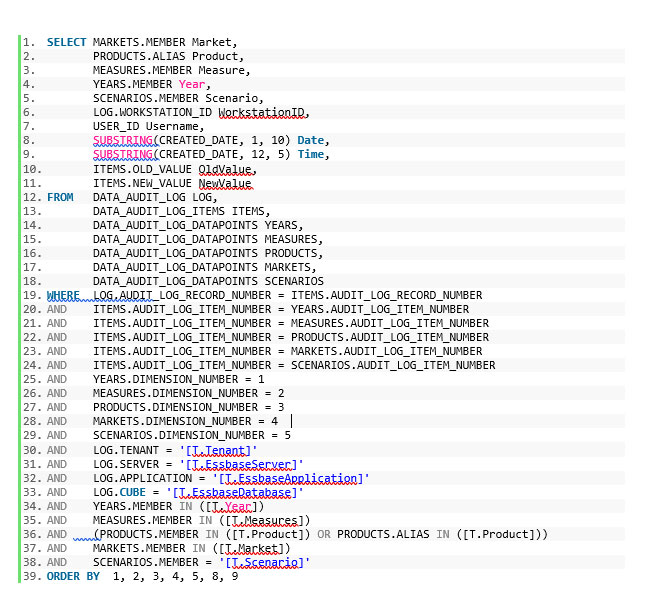
In order to customize this code for any Essbase database you’d need to do the following:
Lines 1-5: Change these to match your dimension names. Add additional lines for each dimension you have past the fifth one.
Lines 14-18: Change these to match your dimension names. Add additional lines for each dimension you have past the fifth one.
Lines 20-24: Change these to match your dimension names. Add additional lines for each dimension you have past the fifth one.
Lines 25-29: Change these to match your dimension names. Add additional lines for each dimension you have past the fifth one. Make sure they are in the order that they appear in your Essbase outline and number from 1 to n.
Lines 34-38: This is where the tokens will be set that specify the exact Essbase intersection to query. Customize this section using your own dimension names. Notice that the Products dimension is set up to look for a Member or Alias.
Creating the SQL Passthrough Dataset
Now that we’ve written our query, we can create a SQL Passthrough Dataset to be used in a Dodeca View. Here are the steps to do that.
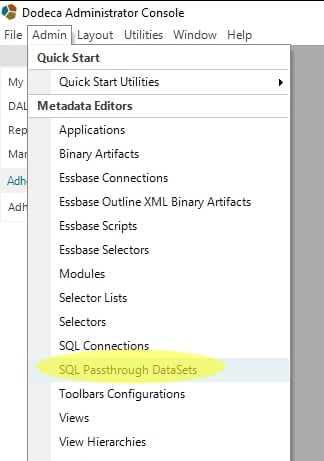
- Go to Admin->SQL Passthrough DataSets.
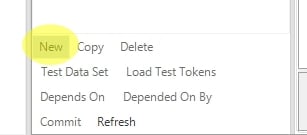
- In the lower left, select “New”.
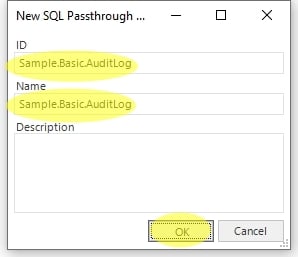
- Choose an ID and Name for the SQLPTDS. In this case I’ve made them the same: Sample.Basic.AuditLog.
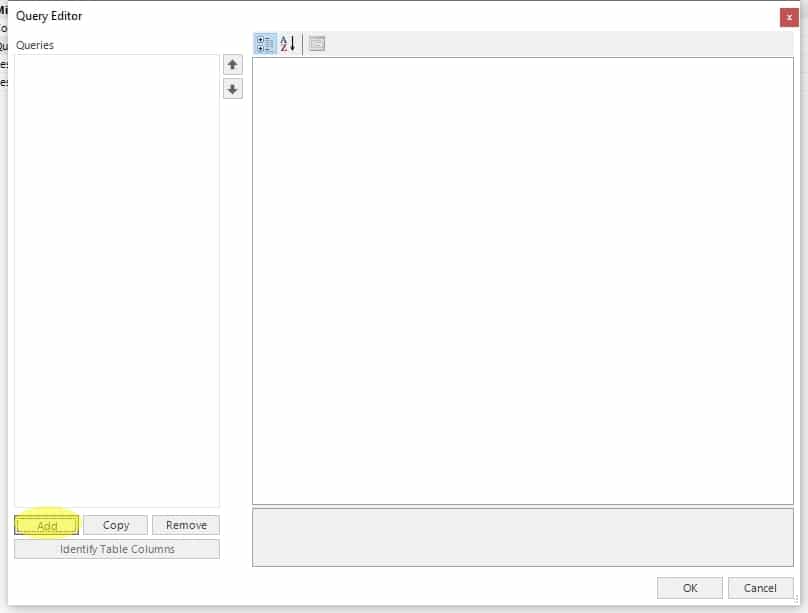
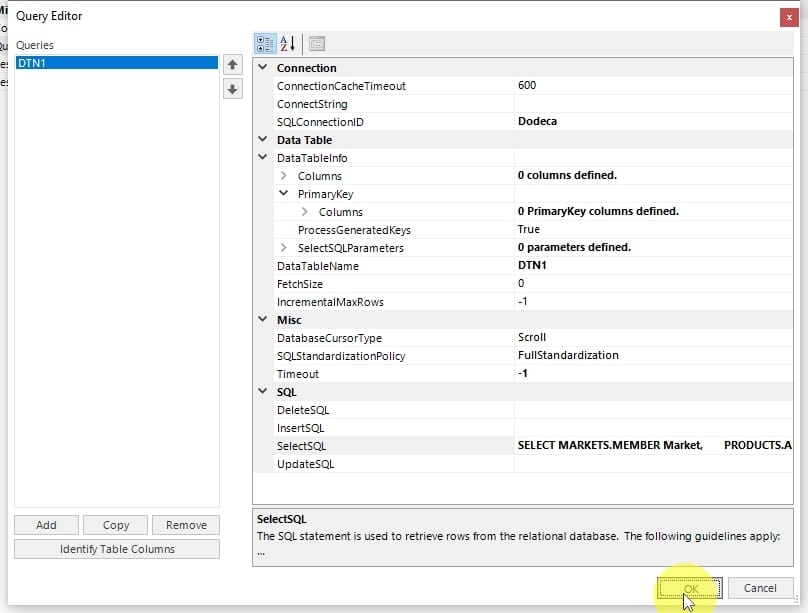
- Click on the ellipsis for the Queries property.

- Press the “Add” button to add a new query.
- In the SQLConnectionID, choose the Dodeca connection.
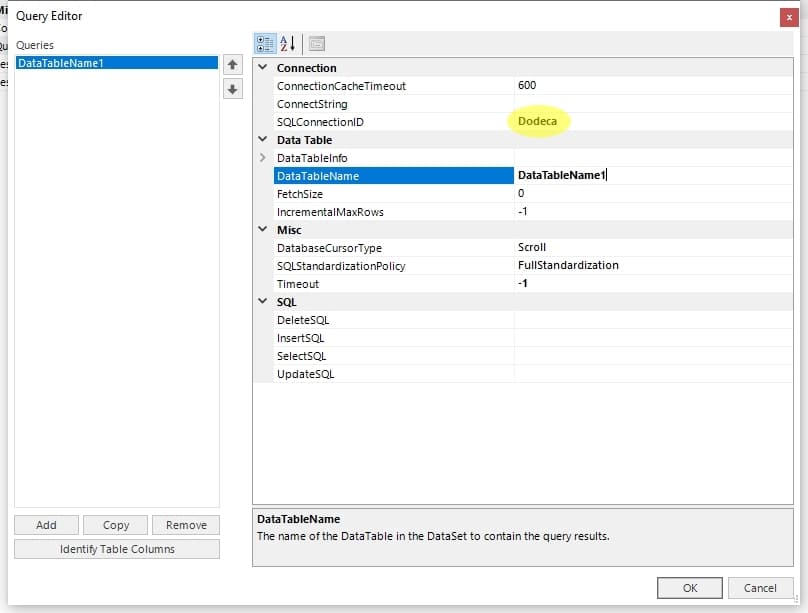
- In the DataTableName property, enter a shorter name like DTN1.
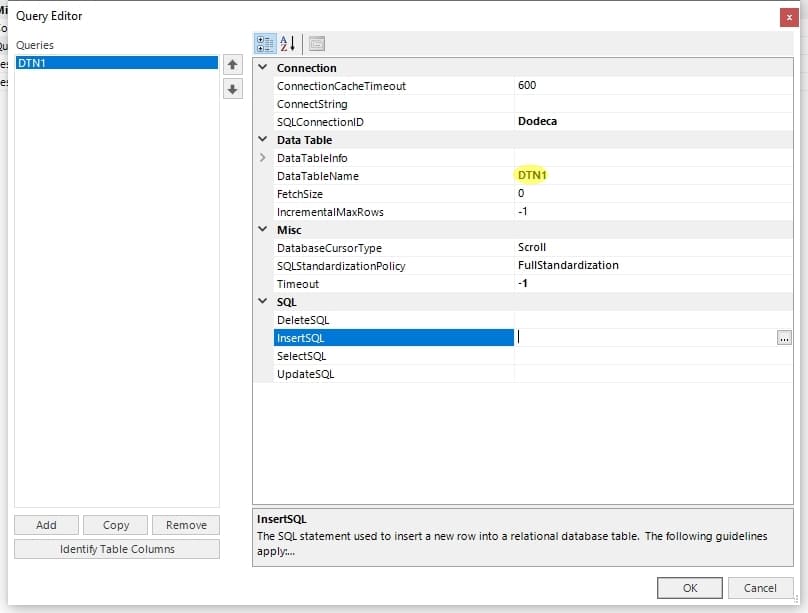
- Click on the elipses for the SelectSQL property to open the query editor.
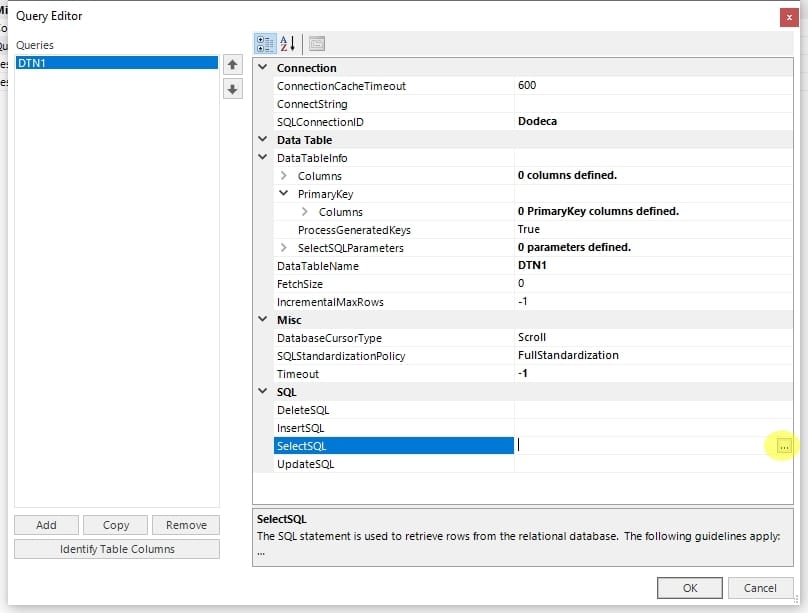
- Enter the SQL query for the view in the editor then click on the “Edit TestTokens” button.
- Enter a value for each token so you can test the query. Prior to this step you should have submitted some data to the Essbase cube for the member intersection you use here.
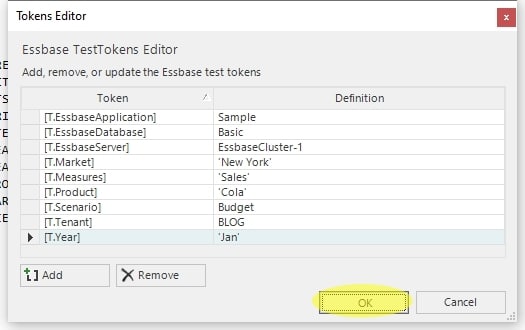
- Press the “OK” button.

- Press the “OK” button again.
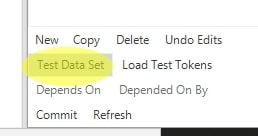
- Select “Test Data Set”.
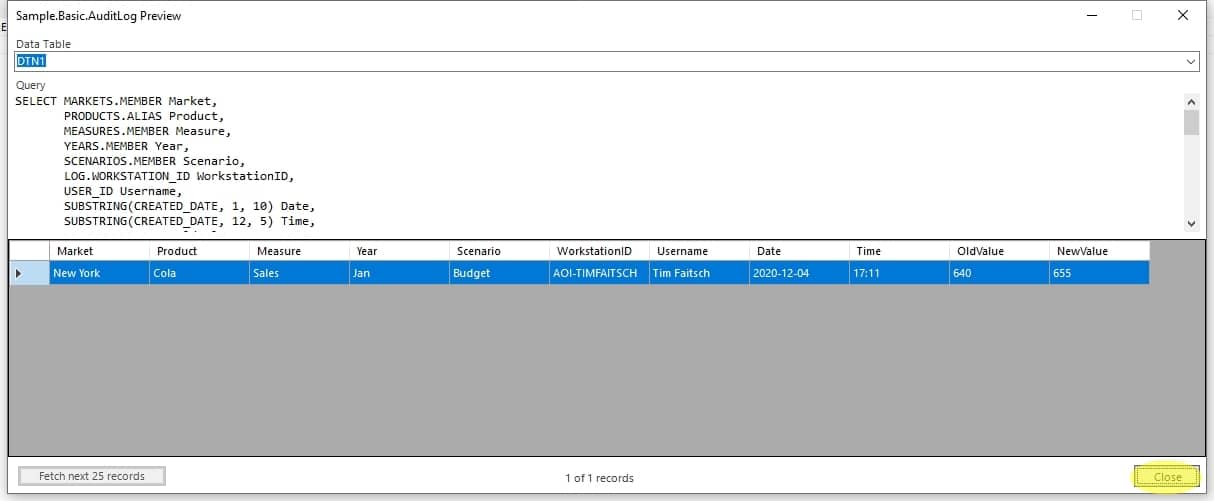
- You can now see the results of the query using our test tokens.
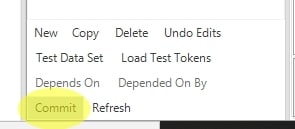
Commit the SQLPTDS to the Dodeca repository. You will now be able to use this in a View.
At this point we have our SQLPTDS created and ready to go. In Part Two I’ll show how to create a Dodeca View that displays Data Audit Log information.

